What's Your WOM/PROM Score?
The critical question any pre-growth innovator faces is: when do I step on the gas?
Move too soon, and you blow your funding chasing traction that never comes, speeding headlong into the deadpool. Move too late, and a competitor sprints to the finish, winning all the fame and glory–while you fume on the starting line, tormented by what-ifs.
You have a small window to get it right (think months, not years) but if you find the tipping point of growth – AKA Product/Market Fit – then everything else will fall into place. Growth conquers all. VCs will fight to invest in your startup, talent will seek you out, the press will write glowing stories highlighting your brilliance, and more. You’ll join the pantheon of mythic entrepreneur heroes who rode the hockey-stick into immortality.
With the path between success and failure so narrow and the stakes so high it’s unsurprising that innovators who ask the obvious question, “When will I know?” are left unsatisfied by the most common answer: “You’ll know it when you see it.” A Catch-22 is bad enough, but worse still is the survivor bias inherent in the advice. Who knows how many others “saw it” and pushed–but were wrong? We don’t hear about them because they aren’t around to tell the tale.
The problem is that the flat-part of the hockey stick isn’t truly flat: it’s filled with fits and starts. For example, consider this user adoption chart where the bars indicate current metrics and the dots indicate two possible future trends.
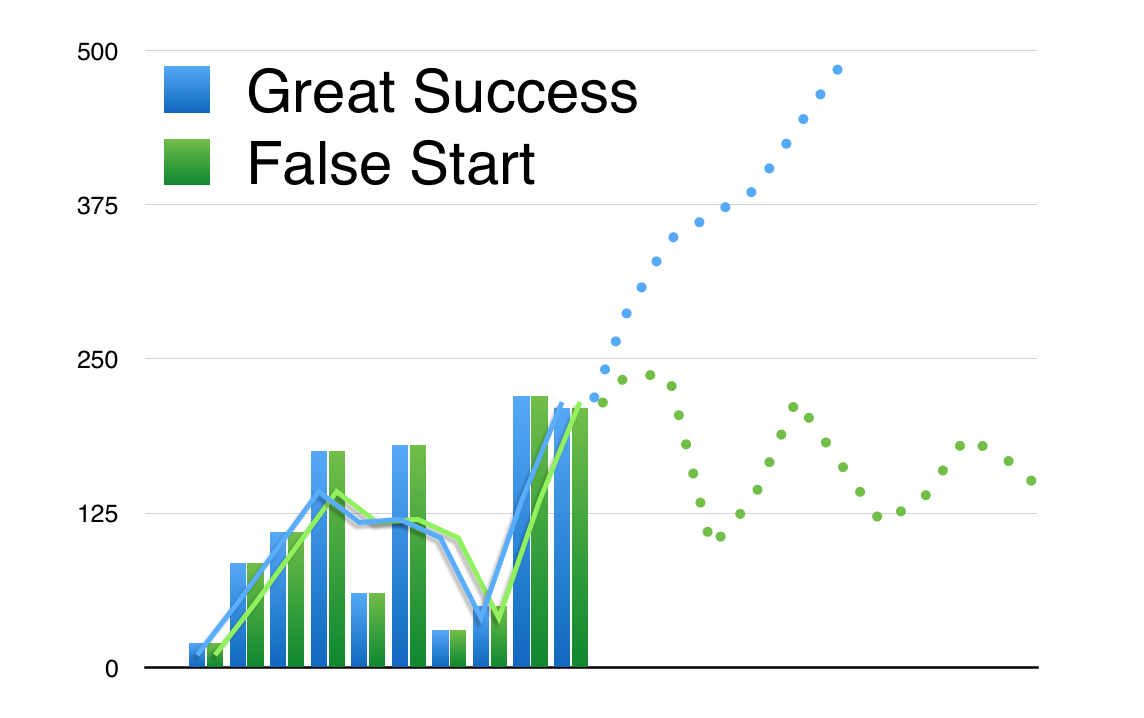
These are the real-world numbers that entrepreneurs see. The overall trend is clearly up-and-to-the-right, but it’s hardly a smooth line. Do we go for it now knowing it might be our only shot at greatness? Or do we wait, risking that others will claim our prize? How can we be sure this is the real thing and not just another false start? It’s a terrifying decision because you can’t know where you are without a frame of reference to the overall curve.
Oh, but you can. The reference point is there–you just need to know how look for it.
The Two Components of Growth–and Which Matters More
To explain, let’s consider the two fundamental sources of growth:
- External: The result of advertising, media, news, signage, product placement, blogging; in short, PROMotional marketing (PROM).
- Internal: The result of customers using the product; referrals, recommendations, observations, conversations; in short, Word-Of-Mouth (WOM).
New adopters will convert from either WOM or PROM, but it does not mean they are equal partners in a growth engine.
To demonstrate, let’s use the Bass Diffusion Model to run some what-if analyses. The Bass formula models innovation adoption as a function of WOM and PROM, and is consistently ranked in the top-ten most important marketing concepts of the past century.
To set a baseline, consider a Bass curve for a fast-moving innovation where the X-axis is time in years since launch and the Y-axis is market adoption. The legend indicates the time in years to peak sales.
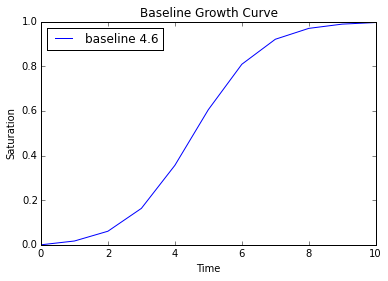
In this model we see slow growth for the first 2 years, followed by rapid adoption, with peak sales occurring 4.6 years after introduction after which the growth rate slows until full saturation in ten years.
Now let’s take the same equation and adjust the PROM effectiveness +/- 50% while keeping the WOM constant. The green curve plots what happens when marketing is improved by 50%, and the red curve when marketing is 50% less effective than the baseline. The better/worse time-to-peak-sales is indicated in the graph legend.
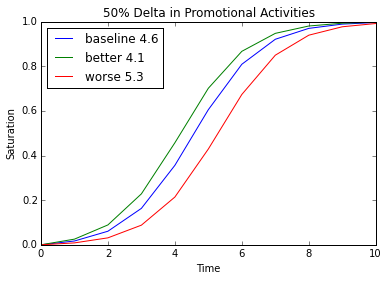
As we’d expect, improving our PROM improves adoption with peak sales moving up by six months, while decreasing pushes it out about eight months.
Next, let’s keep the PROM constant while changing the WOM, again by +/- 50% off the base case:
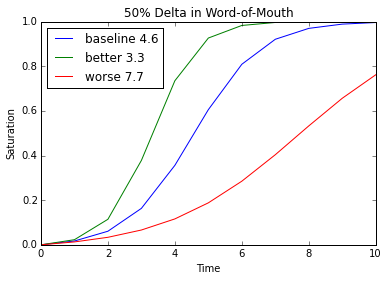
While the degree of change in inputs is the same in both cases, the outcomes are very different. The time to peak sales has improved by more than 16 months in the ‘better’ WOM case, while the ‘worse’ case pushes out peak sales 37 months to 7.7 years.
In short, PROM shifts the curve in time, while WOM bends the curve itself. It’s not that promotional efforts don’t work–better marketing will produce more growth. It’s that promoting an anemic growth curve will merely get you anemic growth sooner; it won’t make the growth any less anemic. This why focusing on marketing before you have a solid product experience is generally a bad idea.
The Tipping Point
Now that we can see how the components work, let’s get back to the original question: when to step on the gas.
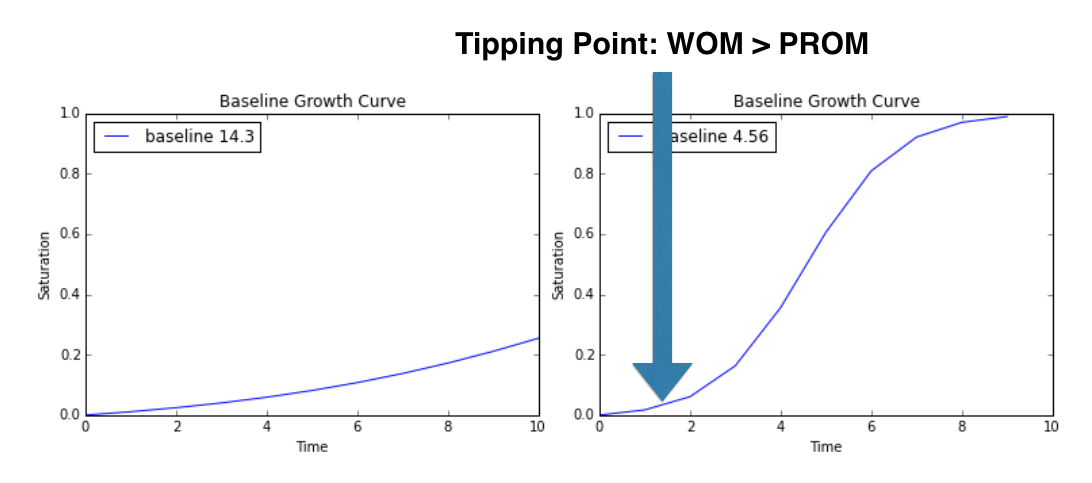
Below are two Bass curves with very different adoption cycles. However, I’m only showing the first year of both curves–the “rest of the story” is masked.

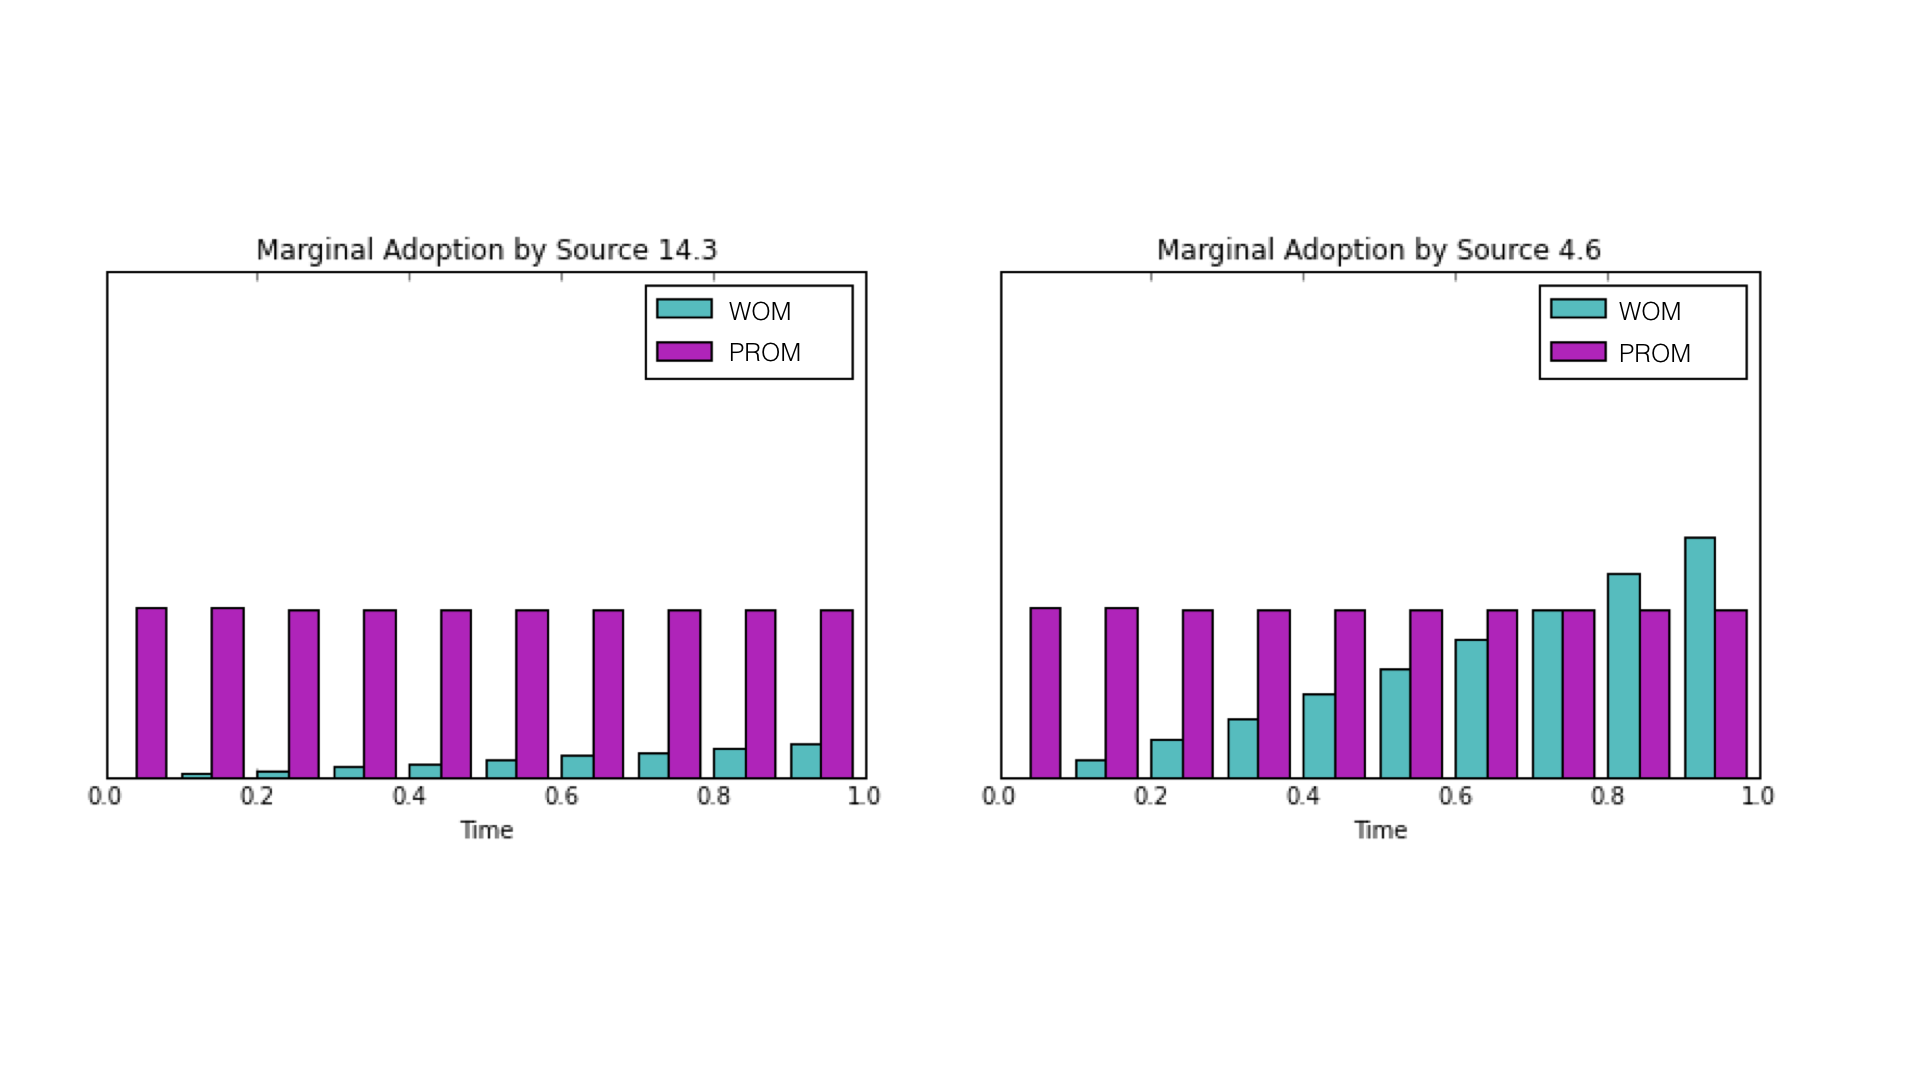
At this point the aggregate graphs are indistinguishable. How can we make a career-defining decision based on so little information? However, if we include the breakdown of user adoption by source–WOM v. PROM–a different picture emerges. Let’s look at the same data that underlie the above graphs, but this time focusing on the WOM/PROM breakdown of each during the first year.
Both charts start at 100% PROM–which is what we’d expect; the first users must come from external efforts since there are no users to provide WOM. However, in the left case the majority of adoption is the result of PROM for that entire first year, while in the right chart the users from WOM increases until it it exceeds PROM around ten months into the year. So let’s now reveal the full curves to see which is which.
In the left case (where WOM is less than PROM), explosive growth is elusive; it’s literally off the chart and so far in the future that you’re out of money before you can reach it. Meanwhile, on the right point at which WOM overtakes PROM (indicated by the arrow) presages the hockey stick by about six months. The relationship between WOM and PROM provides the reference point we need to predict the shape of the curve. Both curves looked identical in the aggregate during the first year, but by breaking down WOM/PROM we were able to identify which of the curves needed funding, and which needed more experimentation.
Our first users will always come from external sources–this must be true by definition since there is no one else to refer them. And if we only get users from external sources then we never will see explosive growth because PROM follows a linear function; you can do more of it but the marginal effectiveness of each dollar spent remains roughly constant. Adoptions from internal sources, in contrast, follow a logistic function; more users means more adoption sources, meaning more users, and so on until it is slowed by saturation. Explosive growth is never guaranteed, but if it is ever to take hold there must be a point where WOM exceeds PROM. That’s the tipping point of growth.
WOM > PROM is the tipping point of growth; get ready to step on the gas.
Application
Calculating the WOM/PROM score (WPS) is fairly straightforward: simply choose a time-sliced cohort of new users (weekly, for instance) and determine whether each individual conversion (or sample thereof) was due to WOM or PROM. Divide the total WOM adoptions by the total adoptions (WOM + PROM) for each discrete period and that’s your WPS for that period. However, unlike Innovation Options, with WPS the math is the easy part. Determining the difference between WOM and PROM is what’s difficult and error prone.
To illustrate, it’s worth comparing WOM/PROM to a similar concept: virality. Viral adoption is based on the same premise–usage driving acquisition–but with virality the product is dependent on a network of users. For instance, Facebook is only useful insofar as there are friends using it. Thus, we seek to engineer an referral mechanism–the viral loop–and measure the adoption coefficient directly. It’s a self-contained system that can be tracked and measured concretely because the actions and actors are well-known.
WOM, in contrast, does not require specific individual referrals. In fact, there don’t have to be direct recommendations at all–there just has to be conspicuous enough usage to generate awareness and drive adoption. WOM is broader than virality and can be applied to products that don’t have an underlying network or adoption loop. However, it also means that determining the adoption source is more subjective than simply counting invite acceptances. Instead, users must be queried to learn what drove their adoption. The WPS is thus a bit lossier than the viral coefficient, but it can be used for a broader range of products.
When choosing the adoption source between WOM and PROM, don’t take ‘word-of-mouth’ too literally: WOM simply means that a new user adopted as a result of other users’ adoption as opposed to marketing. Since potential users often will be exposed to a mix of WOM and PROM, it can be difficult to parse out which of the two is most responsible for any given conversion. Still, with careful attention to proper interviewing techniques, the WPS can be an accurate non-linear growth curve indicator.
In addition, the WPS is not constrained to consumer markets. Although not as conspicuous as consumer markets, enterprise and other B2B companies nonetheless know what tools their competitors are using and share information. Consider Slack, the messaging app. They are clearly in a B2B market but didn’t rely on promotional efforts to drive usage. In fact, they were adding 10,000 users a week and had 135,000 paying customers across 60,000 teams before they had even made their first marketing hire (in late 2014). Clearly this level of growth is an outlier; I mention it not to say “be like Slack” but to show that even in B2B markets WOM drives adoption which makes the WPS applicable.
Limitations
While the WPS isn’t constrained by sector or product, it is constrained by the nature of the innovation itself; meaning, only discontinuous innovations are capable of producing non-linear growth. If you’re releasing a product with a small, incremental improvement (i.e., a sustaining innovation) there is no diffusion to model. So while all products benefit from good WOM, focusing on PROM is more than appropriate for continuous innovations.
Also, it’s worth noting that WOM will always lag PROM. Promotional efforts that immediately bring in new users in turn immediately affect the WPS, while the WOM users that convert as a result of those new users come later. To mitigate this impact, use moving averages and other smoothing techniques rather than relying solely on instantaneous measurements. Still, while any given measurement might be misleading, the overall trend should remain clear.
Also, while the WPS measures the capability of non-linear growth it should not be used to predict market size. A product might grow insanely fast–into a very tiny market. Other tools should be employed to determine the size of the total market in order to justify the size of any potential growth investment. Otherwise, you run the risk of accelerating very quickly into saturation.
Conclusion
The WPS is an essential metric for any product under discontinuous innovation.