The Innovation Engine
On a recent client site-visit I noticed a wall on which were written 100 potential business ideas. Rising fifteen feet off the ground, the list represented wide-ranging opportunity and enormous potential value. Curious, I asked about the progress on each of them, learning that only two were being pursued–the rest languishing as mere words on a wall.
My client was following a common pattern: the innovation team formulates ideas based on the hottest trends, estimating the return on investment for each. Those ideas are then funded in ranked ROI order until the entire budget is allocated–which in this case was a grand total of two. So, as a matter of policy, the firm was deliberately ignoring 98% of their innovation and putting the firm at tremendous risk of disruption.
Consider the following matrix: on the vertical axis we have the decision on whether or not to pursue an idea, either ‘GO’ or ‘NO-GO’. Then, on the horizontal axis, we have the results from the choice: GO was Wrong (the idea wasn’t valid) or GO was Right (the idea was valid).
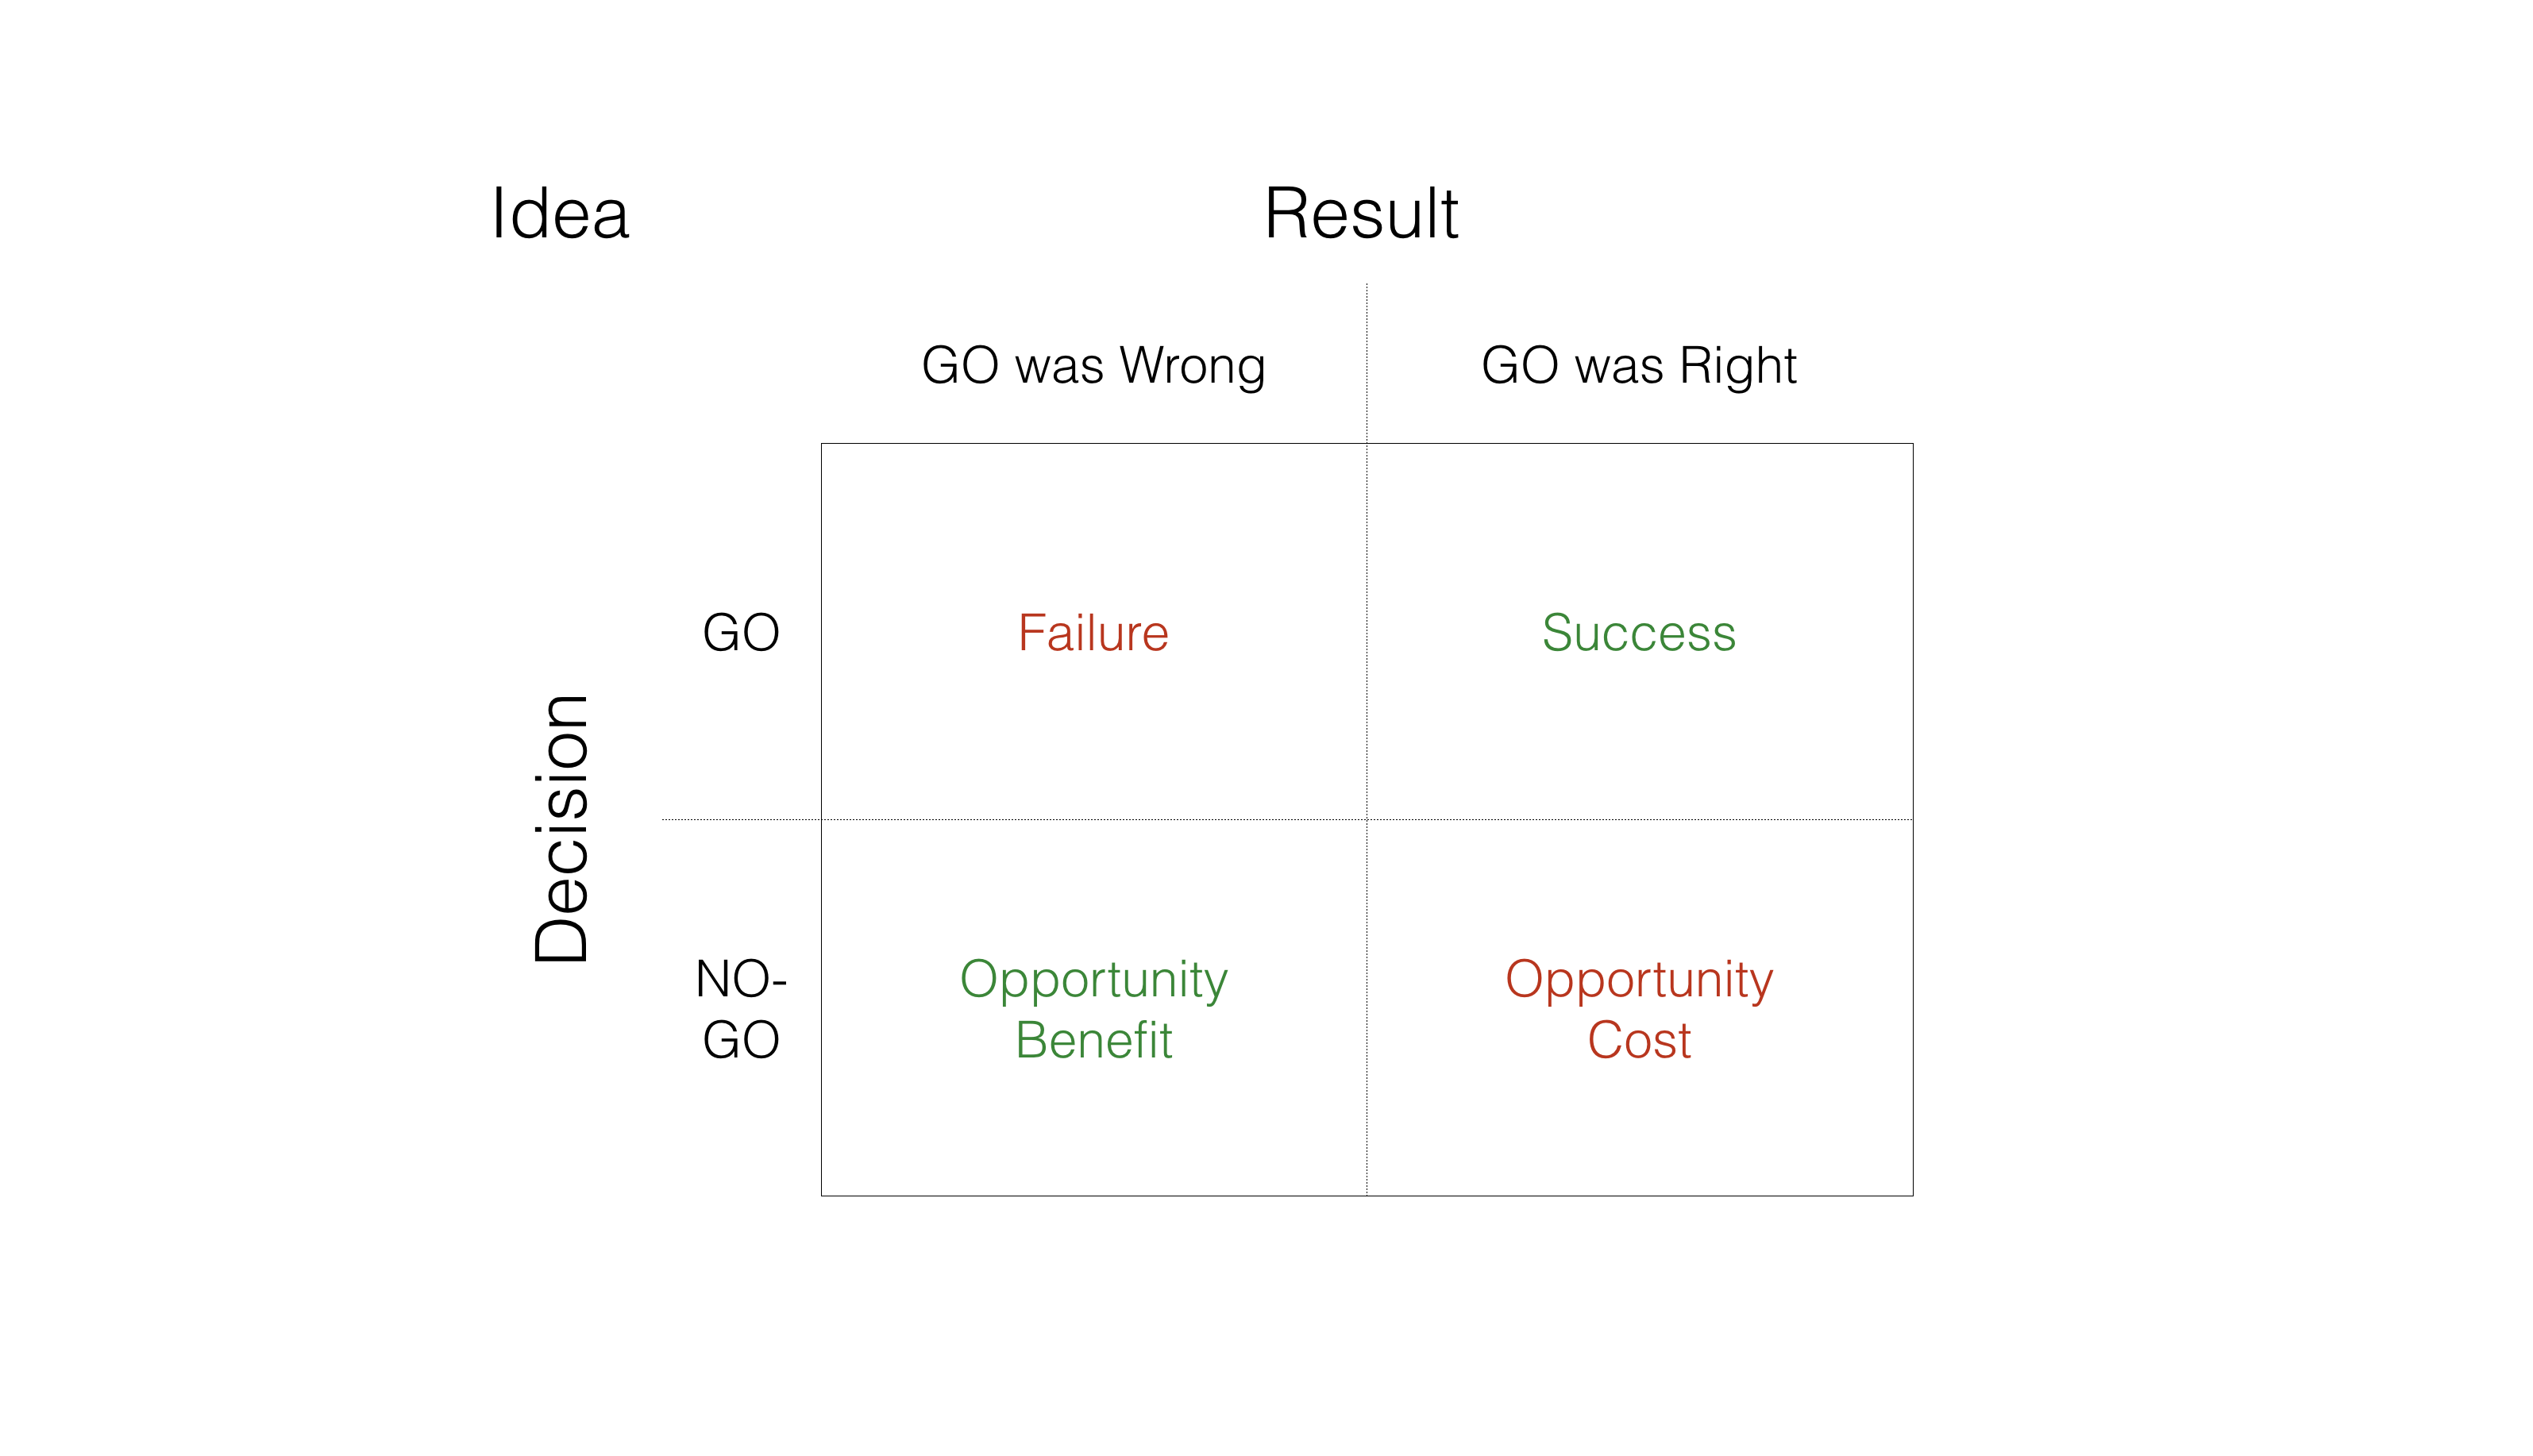
This results in four possible outcomes for any given idea:
- Success: We decided to GO with the idea, and that was the RIGHT decision. This is the True Positive.
- Failure: We decided to GO with the idea, and that was the WRONG decision. This is the False Positive.
- Opportunity Benefit: We decided to NO-GO with the idea, and that was the RIGHT decision. This is the True Negative.
- Opportunity Cost: We decided to NO-GO with the idea, and that was the WRONG decision. This is the False Negative.
Under a traditional budget-allocation model, innovation is only measured along the Positive (ie, the “GO”) axis. Ideas that meet or exceed expectations are considered Successes, those which fall short are Failures, and here endeth the lesson. The Negative (“NO-GO”) axis is totally ignored, because those ideas do not receive funding by definition.
The danger in this approach lies in the Opportunity Cost quadrant, where a firm misses out on the “next big thing” and cedes ground to competitors and new entrants. Unlike the direct cost of Failure, the Opportunity Cost of missing a disruptive innovation can bankrupt even the most dominant firms astonishingly quickly. Yet disruptive innovations will never show a compelling ROI precisely because they are disruptive–AKA “The Innovator’s Dilemma”. Forecasting works with continuous innovations because there are years of data and experience from which we can draw reasonable inferences about the near-term future. But discontinuous innovations have no such history and require an alternative approach if they are ever to be considered. Fortunately, the table itself suggests just such an alternative.
Those with a background in statistics will recognize the decision/result matrix as a binary classification table, extensively used in machine learning algorithms, clinical trials, and a host of other predictive modeling applications. Unlike the traditional approach where we seek to identify existing trends and extend them into the future, the binary classification approach takes assumptions and tests them against reality to reach conclusions. The ultimate goal is an effective Innovation Engine that improves not by becoming a better fortune-teller, but by improving classification through the rigorous and disciplined elimination of error.
Specifically, there are two basic errors we seek to identify and minimize.
- Type I Error, also referred to as alpha and corresponding to a False Positive.
- Type II Error, also called beta and generally corresponding to a False Negative.
Thus, Success is desired but only insofar as it is a True Positive. Equally valid is the Opportunity Benefit of the True Negative, where we can more efficiently allocate scare capital. Similarly, we want to eliminate Failure, but only because it is a False Positive–as we avoid the Opportunity Costs of the False Negative.
In short, it’s not about what’s Positive or Negative, but on what’s True or False. We want the Truth, even if Negative–because accurate bad news is infinitely superior to inaccurate good news.
And this is where it gets difficult–because to get to the Truth we must embrace the thoroughly counter-intuitive notion that every idea is equal until tested. There are no “good ideas” or “bad ideas” prima facia–an idea’s worth can only be assessed in the context of real customers in real markets. For those steeped in the traditional approach this is a radical notion that necessitates a wholly different capital-allocation strategy, along with new corporate governance and accounting regimes. Our performance metrics must be updated to reflect the error-elimination focus on which the Innovation Engine approach is based.
Fortunately, we can adopt predictive modeling metrics for this purpose. The following contingency table, called a “confusion matrix”, outlines various ratios used to improve a classifier.
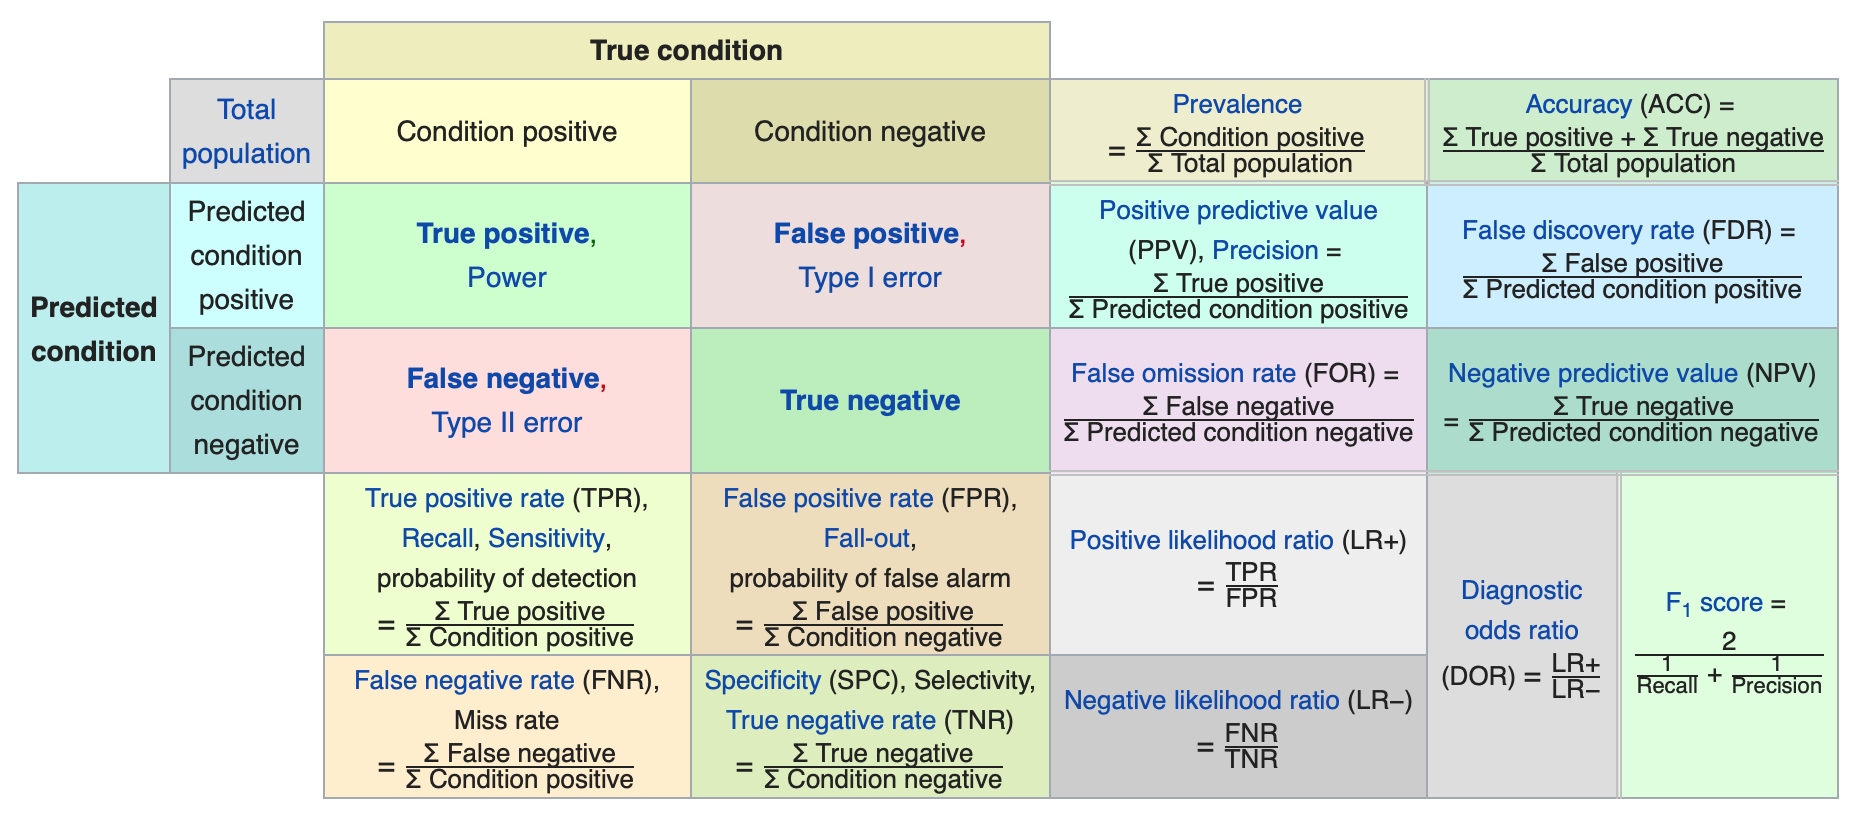
Some key metrics on which we can focus include:
- Accuracy: This is the combined True Positive and True Negative, basically answering “How often are we right?”
- Error: The combined False Positive and False Negative (the reciprocal of Accuracy) or “How often are we not right?”
- Sensitivity: The True Positive Rate, or “When the actual answer is yes, how often do we predict yes correctly?”
- Specificity: The True Negative Rate, or “When the actual answer is no, how often do we predict no correctly?”
- Precision: The percentage of accurate yes predictions, or “When we predict yes, how often are we right?”
- Prevalence: The percentage of yes conditions for all ideas, or “How often do actually see yes?”
Ideally, a firm should emphasize those metrics which reflect their innovation priorities. For instance, firms seeking to ensure the most efficient use of capital should seek high Precision, ensuring that when money is spent it is spent well. In contrast, firms fearful of missing a disruptive innovation might instead highlight Specificity. The confusion matrix provides ample choices to suit the desired corporate governance policy.
Still, the point of identifying error is not simply to track instantaneous performance but to improve the predictive engine itself. For this, we need to clarify between the two fundamental types of error: random and systemic.
Random errors are statistical fluctuations resulting from our instrumentation’s precision limits. It’s why we can take the same measurement using the same method and get different results. For instance, a mercury thermometer might be able to measure temperature to within a few degrees, so a reading of 100° might actually be 99° or 101° simply due to the thermometer’s design. Random error can never be eliminated, but its effects can be minimized by increasing the amount of test iterations or instrumentation tolerance.
Systematic errors are reproducible inaccuracies that manifest in the same manner each time, usually due to problems with the instrumentation or measurement approach itself. For instance, if you have a thermometer that is mis-calibrated by one degree, it will always be off by that one degree in every test. Thus, increasing the number of test iterations will not have any effect on systemic error, but changing the instrumentation or methodology might reveal the problem.
In either case, whenever an error is detected an extensive failure analysis should be conducted to determine what led to that result. Identifying and correcting any error will not undo any past mistakes, but will improve future classification. This is particularly powerful for corporate innovation, since unlike individual startups (that are committed to a single idea’s Success/Failure outcome) firms can play a repeated game and improve their Innovation Engine itself on each idea.
Thankfully for the entrepreneur, this advantage is rarely pressed. Since the traditional approach measures only along the Success/Failure axis, results are always judged within the context of the original estimation. Thus, innovation inexorably becomes focused on coming up with “better ideas” that are divorced from any actual implementation. Viewed through this lens, it is clear why we persist in our worship of the mythic entrepreneur hero wielding the magic napkin: it is the logical choice if we place all our faith in the initial assumptions. Still, if we wish to systematize innovation management we should move away from such priestly divination and focus on a more evidence-based approach.
Employing an Innovation Engine is not without challenges. It requires new ways of thinking about metrics, capital allocation, portfolio management and, most critically, the cultural changes necessary to build an effective and durable engine. However, unless your team has found a magic napkin that can predict the future reliably, your best choice to support the firm’s growth and protect it from disruption should be to run more ideas through an Innovation Engine.