Options Explained
Options are the right, but not the obligation, to buy or sell something in the future at a price determined in the present. In essence, an option delays an investment decision until we have more information about the market. While some use them to speculate, options are more typically used to manage risk under conditions of high uncertainty.
While we may view options as only for Wall Street traders, they are actually quite commonplace in everyday life. For instance, homebuyers usually ‘lock-in’ their mortgage rate before shopping; if rates go up, they pay the locked in rate. If rates go down, they can take the cheaper rate. Thus, by purchasing a ‘mortgage rate option’, buyers can start shopping for a home knowing exactly what they can afford without having to worry about fluctuating interest rates.
Other forms of options are farming futures, fuel rate swaps, life insurance policies: basically where there is risk to be managed you’ll generally find options that manage it.
Payoffs
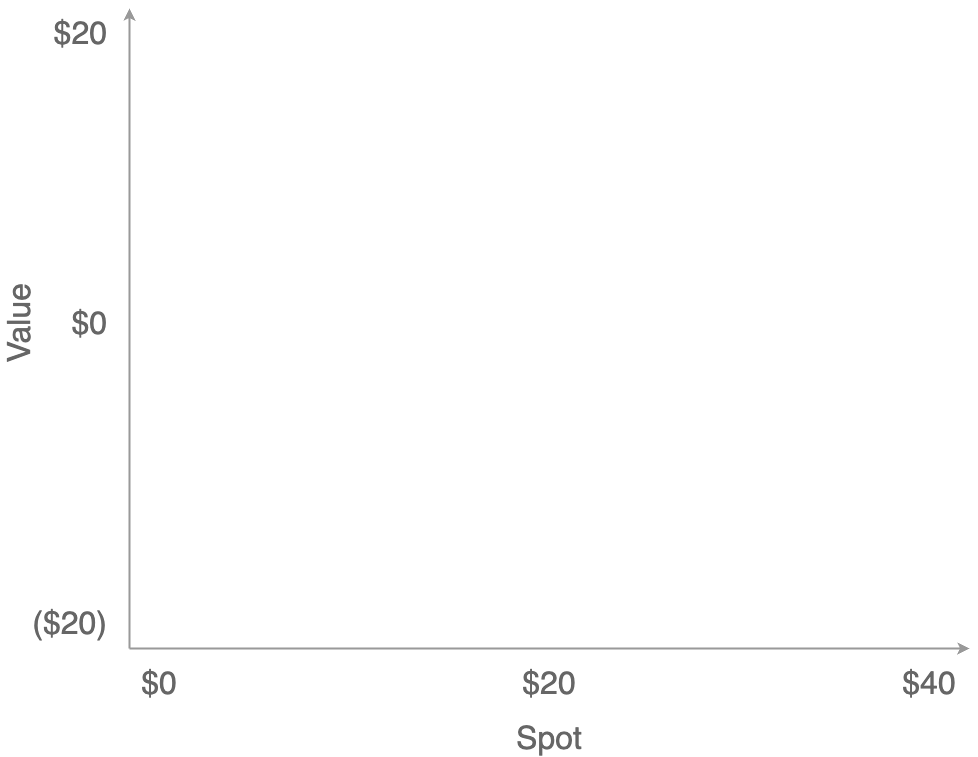
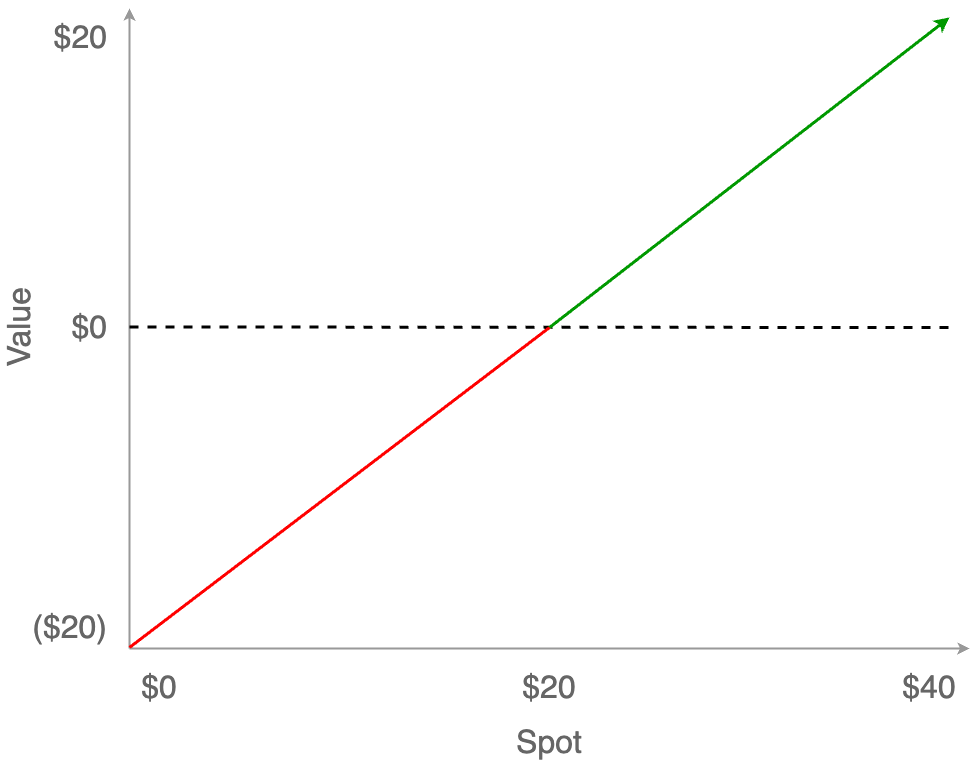
Let’s dive in a bit deeper with some visuals to help. We’ll start with a simple payoff graph. The y-axis is the current paper Value of the investment (ie, the net profit if we sold), while the x-axis is the Spot (the current market price of the underlying instrument to which the option is tied.)
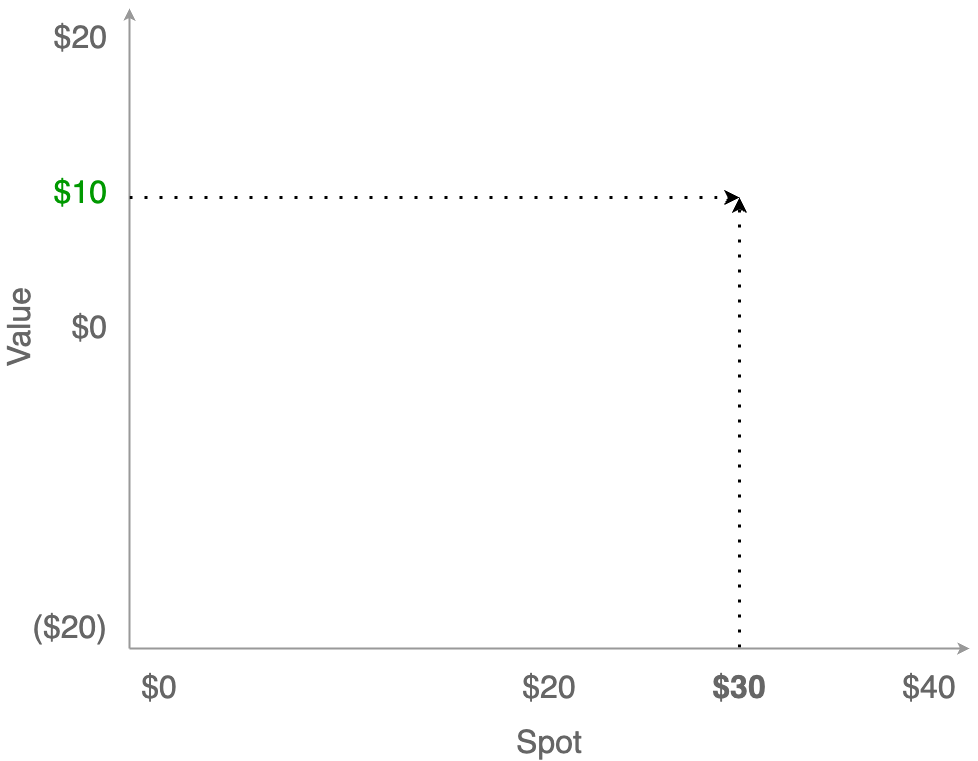
Now, let’s say you own a stock for which you paid $20. If the market price for that stock is at $30, then the current unrealized value of the stock would be $10 (30 - 20).
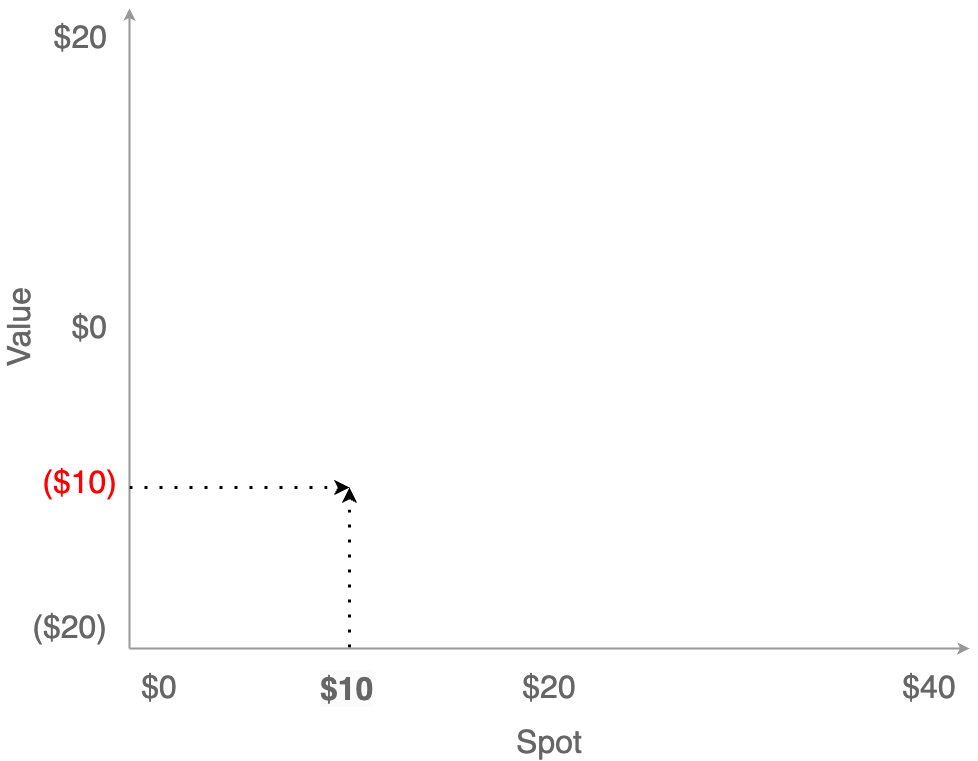
And if the price falls to $10, then you have an unrealized loss of $10 (20 - 30).
So this is the full payoff curve; you could lose the entire $20 investment, or you can make money as long as the stock price keeps rising, with a breakeven point of $20.
Options
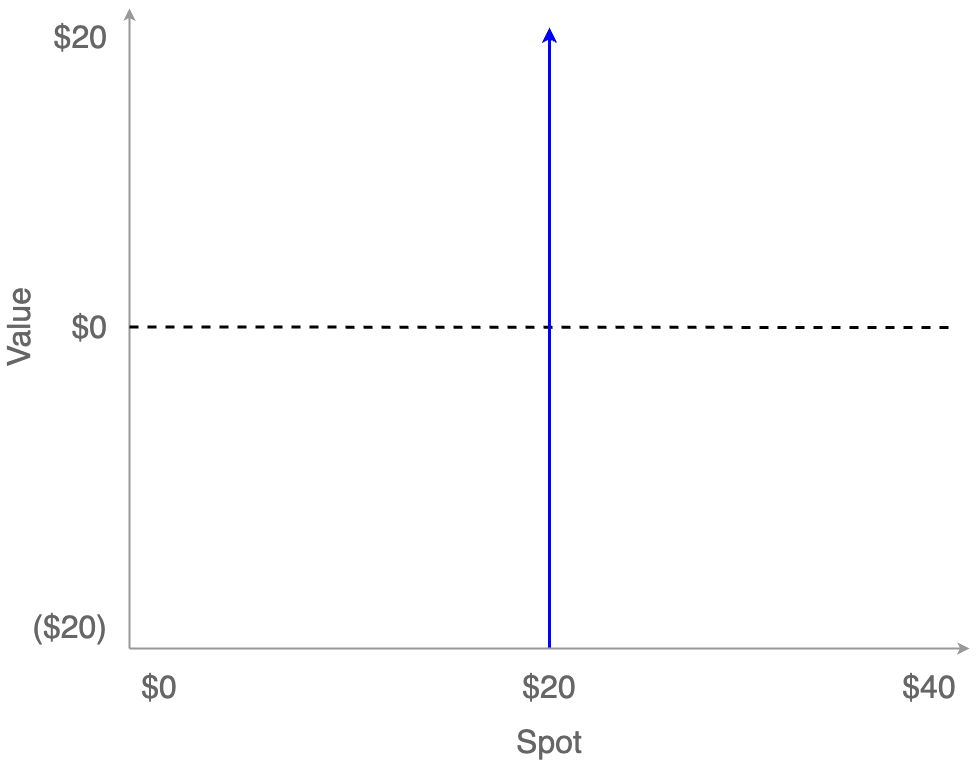
Now let’s consider an Option, specifically the option to buy a stock (termed a call option in the lingo; options to sell are termed put options.) Here, instead of buying the stock immediately for $20 we’ll instead have the right to buy it at some point in the future for $20. This price is called the Strike price.
Here is the Strike price plotted as the blue line (the same place as before).
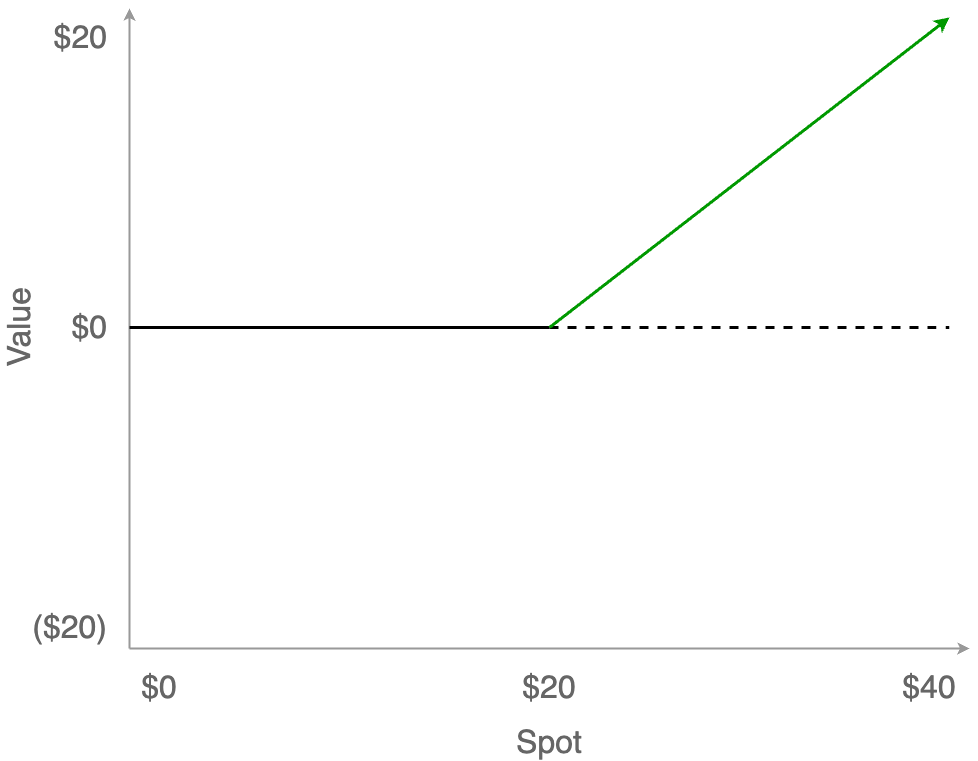
When the stock price goes up, the value of the option goes up just like before. If you were to exercise this option, you would pay $20 for the stock, which is worth $30, meaning the option is worth $10 at that particular spot price. This is called being “in the money”.

However, unlike before, when the stock price falls below $20 we don’t lose money. Remember: an option is the right but not the obligation to buy something. So, since we don’t have to spend $20 to get something that’s only worth $10, we simply do nothing and let the option expire. This is called being “out of the money”.
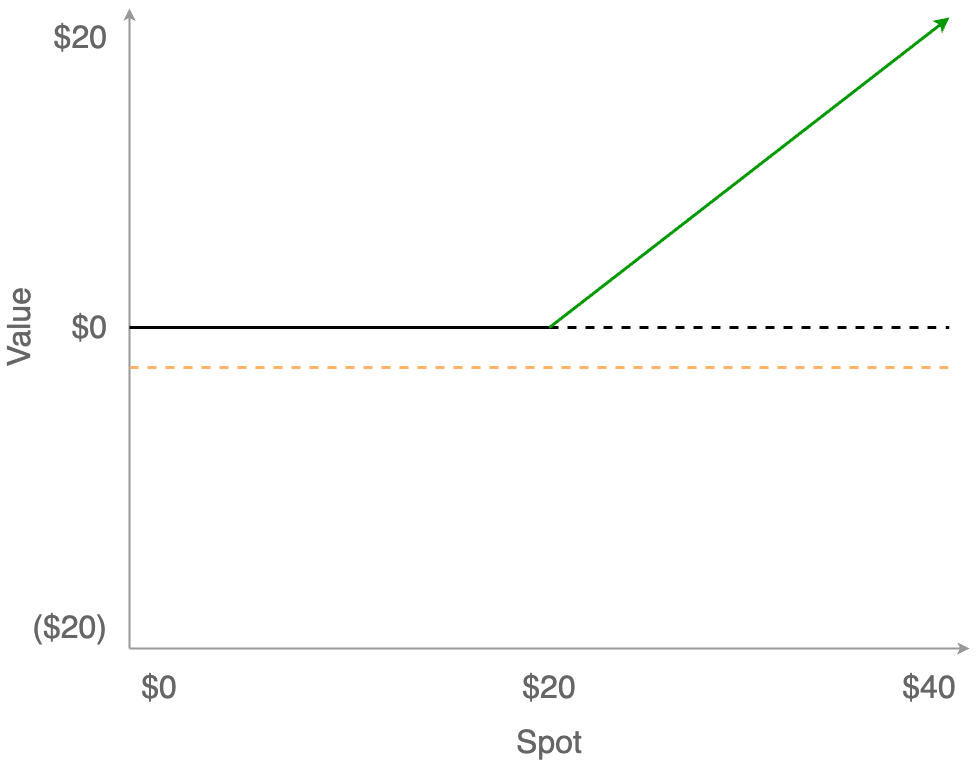
This produces a one-sided payoff curve that is characteristic of options. While the upside of the option is unbounded if the price keeps rising, nothing happens if the price falls (even to zero.) You can’t lose!
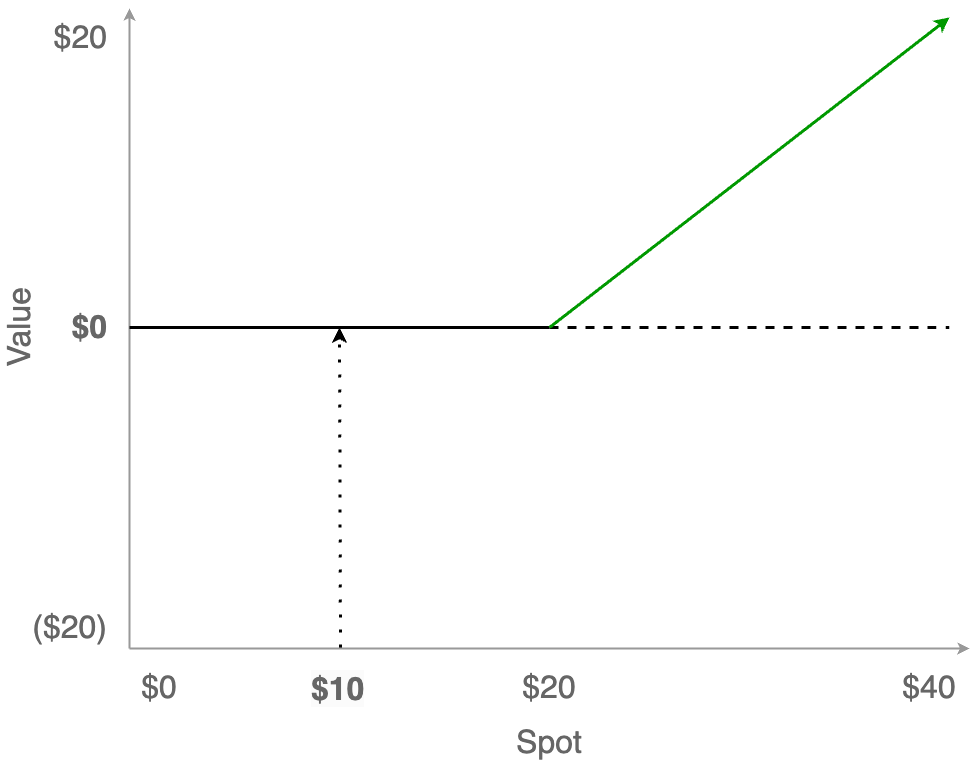
Of course, this optionality doesn’t come for free; you have to pay for the right to buy at $20. This is called the Premium, and for this option we’ll say the cost is $2 (added to the chart as the dotted orange line.)
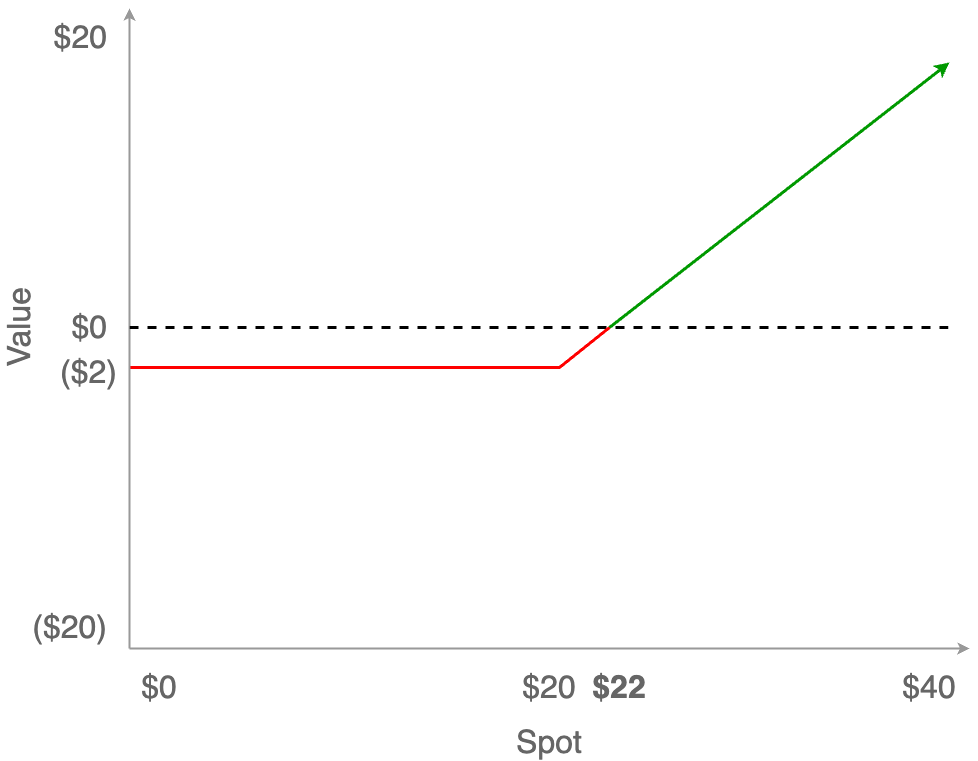
Of course, this means that we need to shift the entire payoff curve down by that same $2 Premium. Before, the breakeven point was $20, but now the breakeven point is $22: the $20 to buy the stock (at the Strike price), plus the $2 for the option itself (the Premium.) So now we can actually lose money, but that loss is limited to the $2 option Premium, and while the upside remains unbounded it is reduced by that same amount overall.
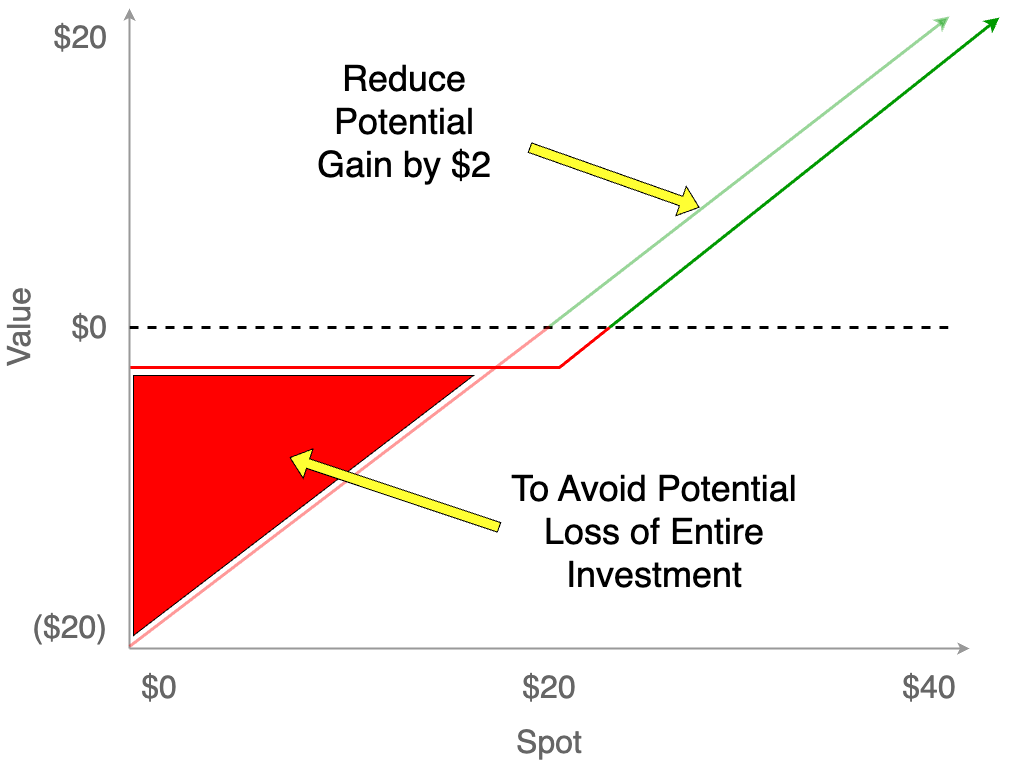
When we overlay the two curves, we can see why options are so valuable. Yes, the breakeven point is a bit more and we’ve given up $2 of upside, but overall we’ve greatly reduced our downside risk for a (relatively) small amount of money.
Summary
Options and other derivatives can get very complicated, but they will share most of these same basic characteristics. Again, the point is to delay investment decisions until we have more information, thus managing risk under conditions of high uncertainty/volatility.