Measuring Learning in Dollars
It starts innocently enough. An enterprising Product Manager comes up with an idea that represents a high-growth opportunity for the firm. He runs the proposal by Finance who naturally wants to see the ROI. The PM knows how much investment he needs, so the I is covered–but the Return? That’s when entrepreneurial enthusiasm meets corporate reality.
He knows the revenues must be high enough to justify the riskiness of the new product. But he also knows if he doesn’t meet those targets he’ll get killed at quarterly reviews, even though it’s nearly impossible to accurately forecast revenues for products that don’t exist. Still, if he doesn’t show the ROI he’ll never get funded, so he presses forward even though he knows it’s a trap.

The PM might grouse that “Finance just doesn’t get it”, but let’s remember that someone has to decide on the most effective use of the firm’s scarce resources. Every idea seems promising, but there isn’t an entry on the balance sheet for wishful thinking–we must measure in dollars. Moreover, Finance is on the hook too–if the project goes south she’ll be accused of not doing enough diligence and must pay a price as well.
Nor does the C-Suite escape the trap. While these outcomes represent potential failure, humiliation and career-threatening danger to the innovators, it doesn’t represent the biggest threat to the firm: namely, that most employees avoid the trap by not innovating at all. As a result, the the firm atrophies and loses ground to competitors, eventually costing the CEO her job as well.
It doesn’t have to be this way.
The Problem
The problem is in how we calculate ROI. Predictions made under conditions of uncertainty are unreliable by definition, but traditional approaches (such as NPV) require them nonetheless. It forces the entrepreneur to make the project’s most critical decision at the precise moment when there is the least amount of information. Moreover, it removes all flexibility because the original assumption can no longer be adjusted without calling into question the financial basis on which the entire proposal is based.
The Solution
Instead, what’s needed is an approach that can value innovation (what finance needs for effective corporate governance) while delaying investment decisions until we know more about the market (what product needs to be successful.) We need a tool that can measure learning in dollars, allowing Product and Finance to speak the same language and keep them aligned to the same goal under conditions of uncertainty. In short, we need Innovation Options.
Innovation Options
In finance, an option is the right–but not the obligation–to buy or sell a security in the future at a price fixed in the present. Financial managers use options extensively to hedge portfolio risk, but they are also present in agriculture (commodity futures), real estate (mortgage locks), air transportation (fuel swaps) and various other industries subject to volatile markets. Basically, wherever there is risk to be managed you will generally find options that manage it.
Innovation Options apply the financial option framework to new product development. They precede the normal product lifecycle and do not require specific revenue projections that trap the Product Manager. However, they still satisfy Finance by providing normalized measures of risk and return that are necessary for effective corporate governance. Here’s an example of how they work.
Example
John is a Fortune 500 product manager for a line of household consumer goods. He sees disruptive potential in Artificial Intelligence and believes an AI-powered doorbell could be just the innovation his aging product line needs to spur new growth. As with any new proposal, John must present his business case to Sarah, who heads the investment committee that approves new projects. The business case must show the ROI, but John is hesitant to present a traditional NPV analysis because he has no confidence forecasting revenues for a non-existent product category. Instead, he decides to frame the project as an Innovation Option.
Determine the Inputs
John has to provide three inputs to the Innovation Option model:
- Main Investment Budget John is very good at budgeting costs (he is a Fortune 500 PM after all) and believes that the doorbell could be produced at scale with a $20M investment. This includes all the normal development and marketing costs such as headcount, capex, promotion, etc.. It is, in effect, the budget request he would have made under a traditional NPV approach. For an option, this is known as the Strike.
- Project Schedule Next, John has to set up a schedule and evaluation timeline. His doorbell project is not an open-ended research exercise; he will be expected to test the market and report results. John has extensive experience with stagegate, so again this task will feel familiar. In this example we’ll keep things simple and use a duration of one year and with quarterly reporting. For an option, this is used to calculate the Expiration and Iterations.
- Risk Estimate Finally, John needs to estimate the relative riskiness of the project. And risk in this context is not specific to the project such as whether finance will approve or the success estimate; it is instead the relative volatility of the market which John’s project will enter. He estimates the risk as moderate. For an option, this is known as the Sigma.
Creating the Model
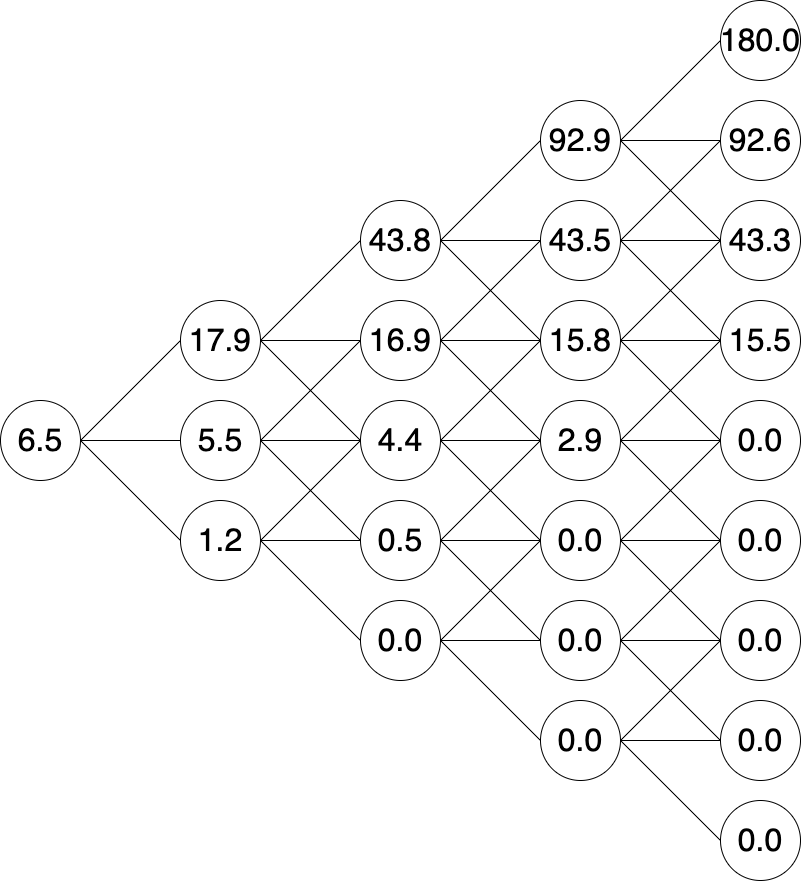
The math for an Option is more complicated than NPV (a version of this pricing model won the Nobel Prize for economics after all) but here is the gist: the model simulates every possible combination of things going well, things going poorly, or things staying the same. Then, it sums the discounted expected value of each of those individual paths to that point. The net result is a tree representing every potential value of the option at every point in time. Future posts will go into the math in more detail, but for now simply know that this same method is trusted to price billions of dollars worth of options worldwide, every day.
Once applied, the inputs produce a pricing tree that looks like this (in millions of dollars):
Getting Started
Before we can do anything we need to get the project approved, which means figuring out the ROI. From the tree, we can see the initial value of the option at time zero (i.e., the left-most point) is $6.5M. This is the current return of the option, today, before any work has commenced. To have a positive ROI, John must propose a budget for the option no greater than that number. (To be clear, this is separate and distinct from the “main investment budget” that John proposed as his first input.)
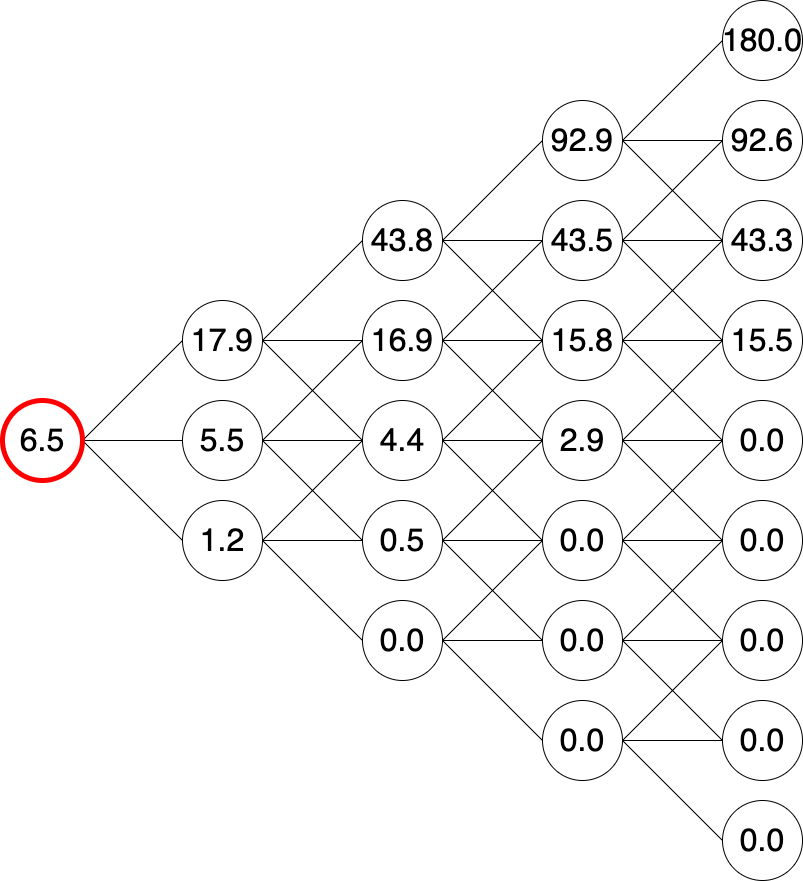
Again, John’s a budget wizard so he quickly outlines a plan that will cost $2M over the course of the year. This includes all the resources he’ll need to produce demos, prototypes and fund his team during that period. Therefore, the ROI is simply the $6.5M less than the budget request of $2M, or $4.5M.
John sits down with Sarah and pitches the entire business case, including showing the NOV (Net Option Value) of $4.5M. After reviewing all the potential projects in the pipeline, she and the investment team approve the funding request for the option, and John gets to work.
Using the Model
Since the model represents whether conditions have moved up, down or stayed flat, we only need to ask a single question at each evaluation in order to determine which node represents the option’s current value:
Given what we have learned since the last iteration, are we in a better, worse, or about the same position as we were before?
That’s it. We don’t need to revise, recalculate, or re-estimate. The model has already done the work for us in computing each possibility; we simply need to figure out which one to use. This simple, straightforward and flexible implementation means that it can easily integrate into existing workflows with minimal disruption. Let’s consider three different scenarios to see how this works:
The Good
John’s business plan depends on being in the proper retail channels, so during the first quarter he concentrates on validating this assumption. He builds a quick demo unit and pitches the doorbell to the top home-improvement retail stores. These discussions go very well, and John secures four signed MOUs indicating their intention to become distributors.
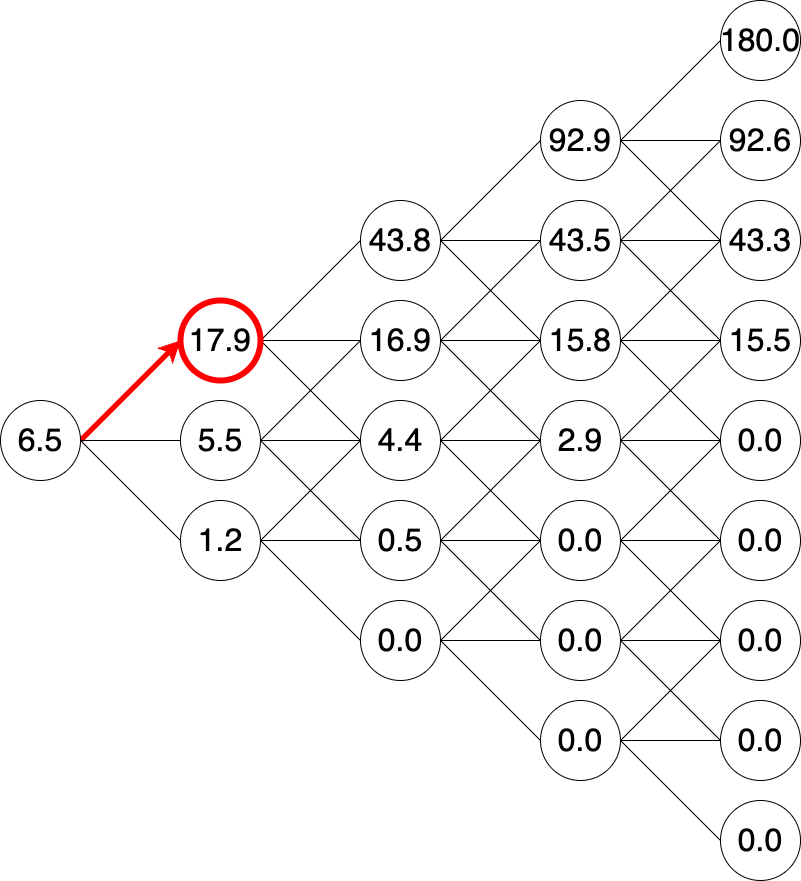
At the first quarter evaluation, John presents this result to Sarah and the review board, who agree that this is good progress. They formally upgrade the project, and the return increases by $11M to $18M.
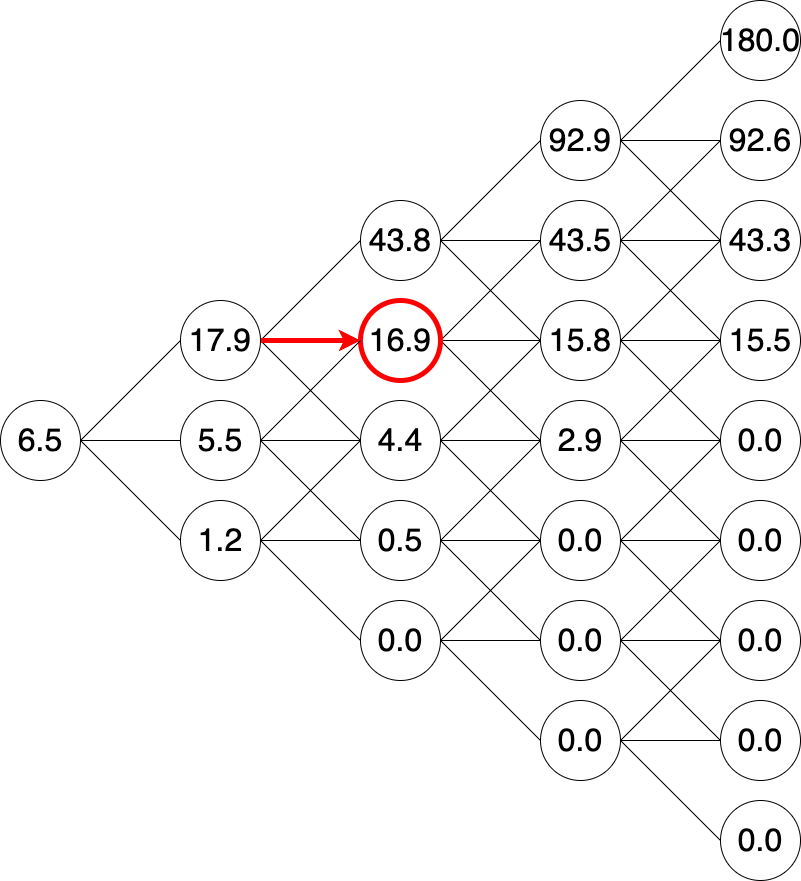
During the second quarter John team builds more substantial working prototypes, tests collateral and messaging, and produces the formal distribution agreements. At the six month milestone negotiations are moving forward but there still aren’t any signed agreements. So, at Q2 the board considers things about the same, and the evaluation is flat. The expected value now falls to $17M.
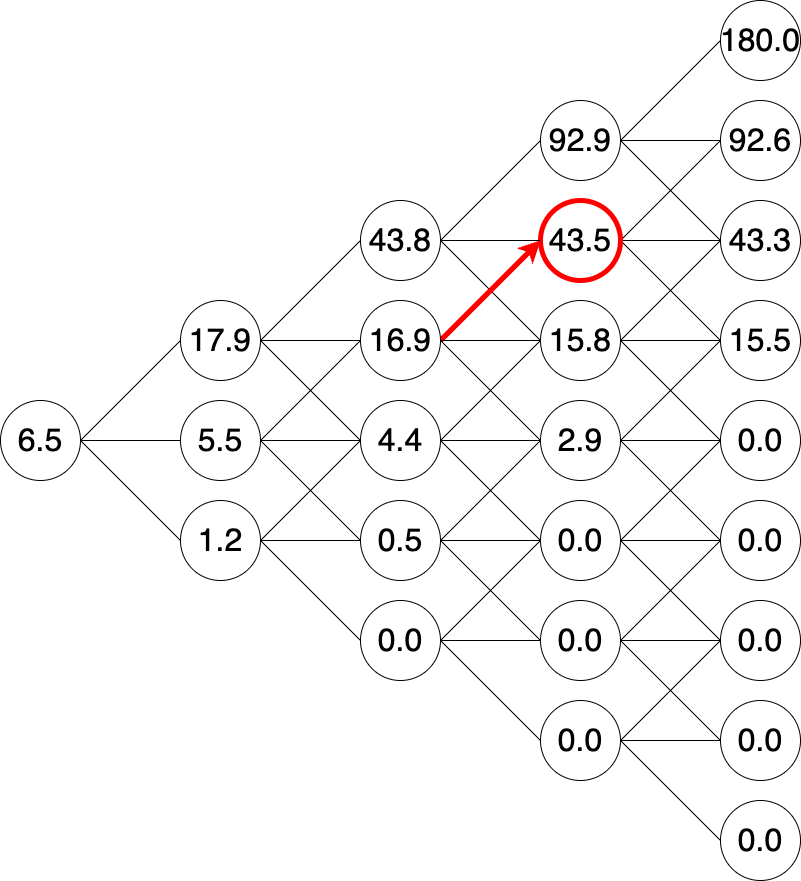
During Q3 legal approves the copy and signatures start coming in. As part of the agreement, John gets approval to start selling the product in certain test markets. He starts low-volume product runs of his prototypes and gets the product into the stores to see how well they sell. The investment board agrees the signatures are good progress and they upgrade. The expected value now stands at $44M.
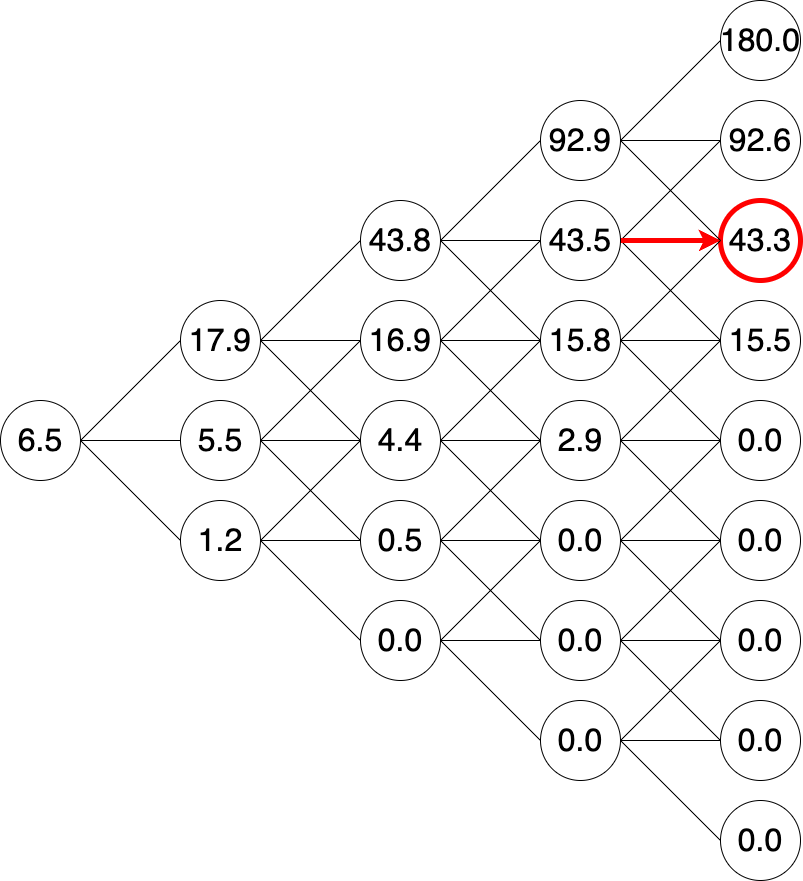
During the final quarter John focuses on unit sales and refining the marketing plan. By the end of the period, sales are in line with expectation; not great, but not terrible either. He learns through customer interaction ways that he can improve the product marketing, but the news is inconclusive and so the final evaluation is flat.
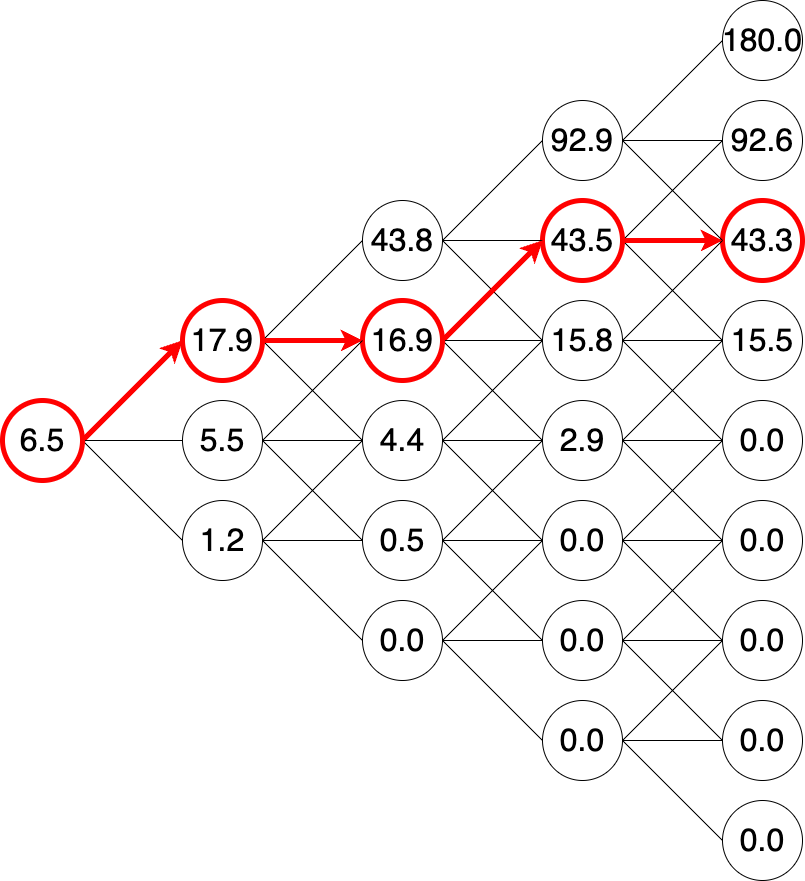
We now see the full path of the project. While things didn’t always go as planned, we still clearly are “up and to the right”. The expected return of $43M is clearly profitable and the investment board exercises the option. This means the main $20M investment is approved and the doorbell moves to full production–well ahead of the game with signed distribution agreements, working units, current sales and actionable customer feedback already in place.
The Bad
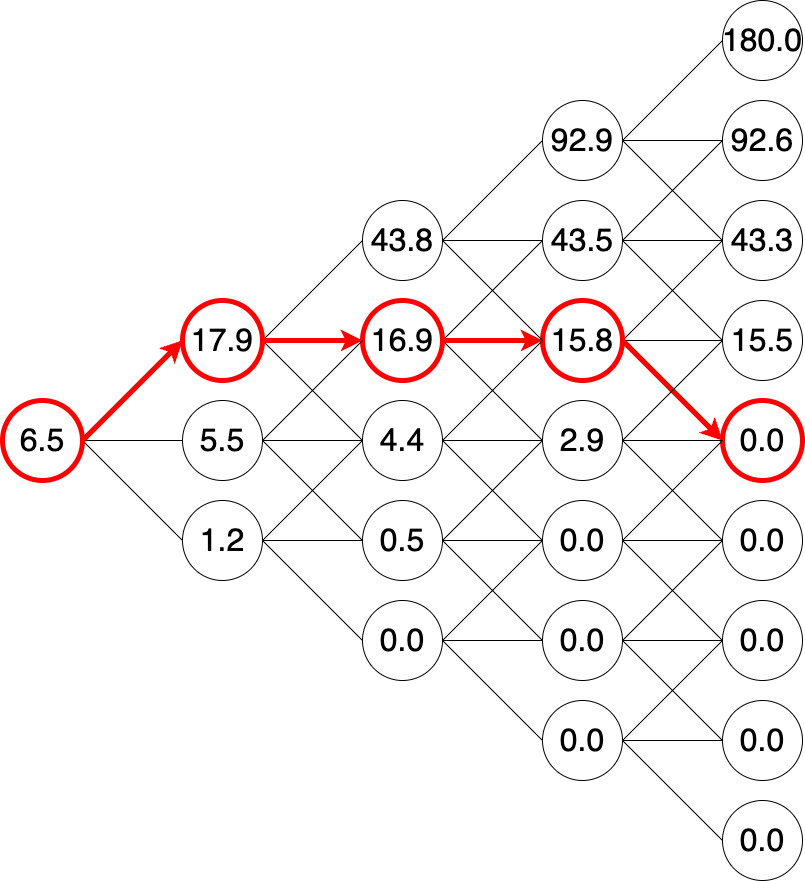
Of course, things do not always take the happy path. Instead, let’s consider what happens if in Q3 instead of signing the distribution agreement things get pushed back again – another flat move. Then, in Q4, the shoe drops and the retail partners refuse to sign: a clear downgrade. The option value drops to zero, and the project does not proceed at scale since it makes no sense to invest $20M building a product that no retail channel will carry.
The Ugly
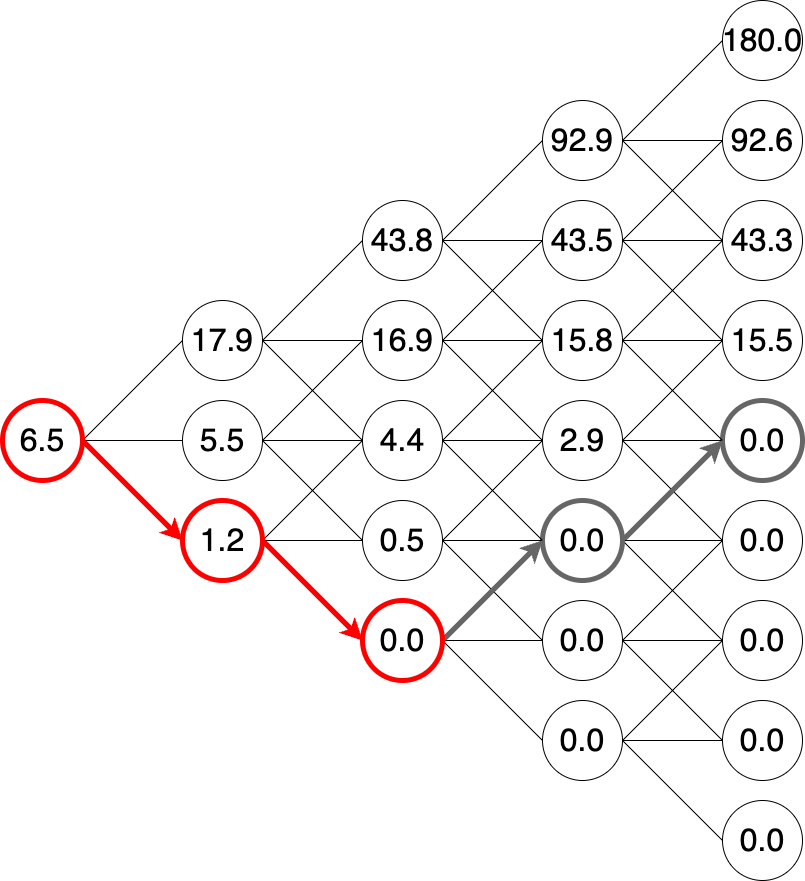
Sometimes things go really poorly. Let’s say this time John goes through the first two quarters trying to generate interest from retail partners and gets nowhere. At this point the model shows that even if he upgrades at every remaining iteration he can’t get the value of the option above zero. Since it makes no sense to continue if there no chance of becoming profitable, at the Q2 review the decision is made to cancel the option and recoup the remaining funds. (As an aside, it’s worth noting that the pricing model helps dispassionately guide a decision that is otherwise very difficult and fraught with emotion.)
Summary
The Innovation Option model measures learning (what your early-stage Product team should be doing) in dollars (what your Finance team needs for effective corporate governance.) It provides a simple, easy to implement approach that minimally disrupts existing workflows. And it doesn’t simply mitigate risk, it reduces it through iteration. Firms seeking to innovate faster with better results and less risk should make Innovation Options the first step in their new-product initiatives.